The Spreadsheet Trading Journal
You Don't Have to Build
You like the spreadsheet workflow — rows, columns, quick edits. You just don't like rebuilding formulas every time. TradeLog keeps the table and does the math for you.
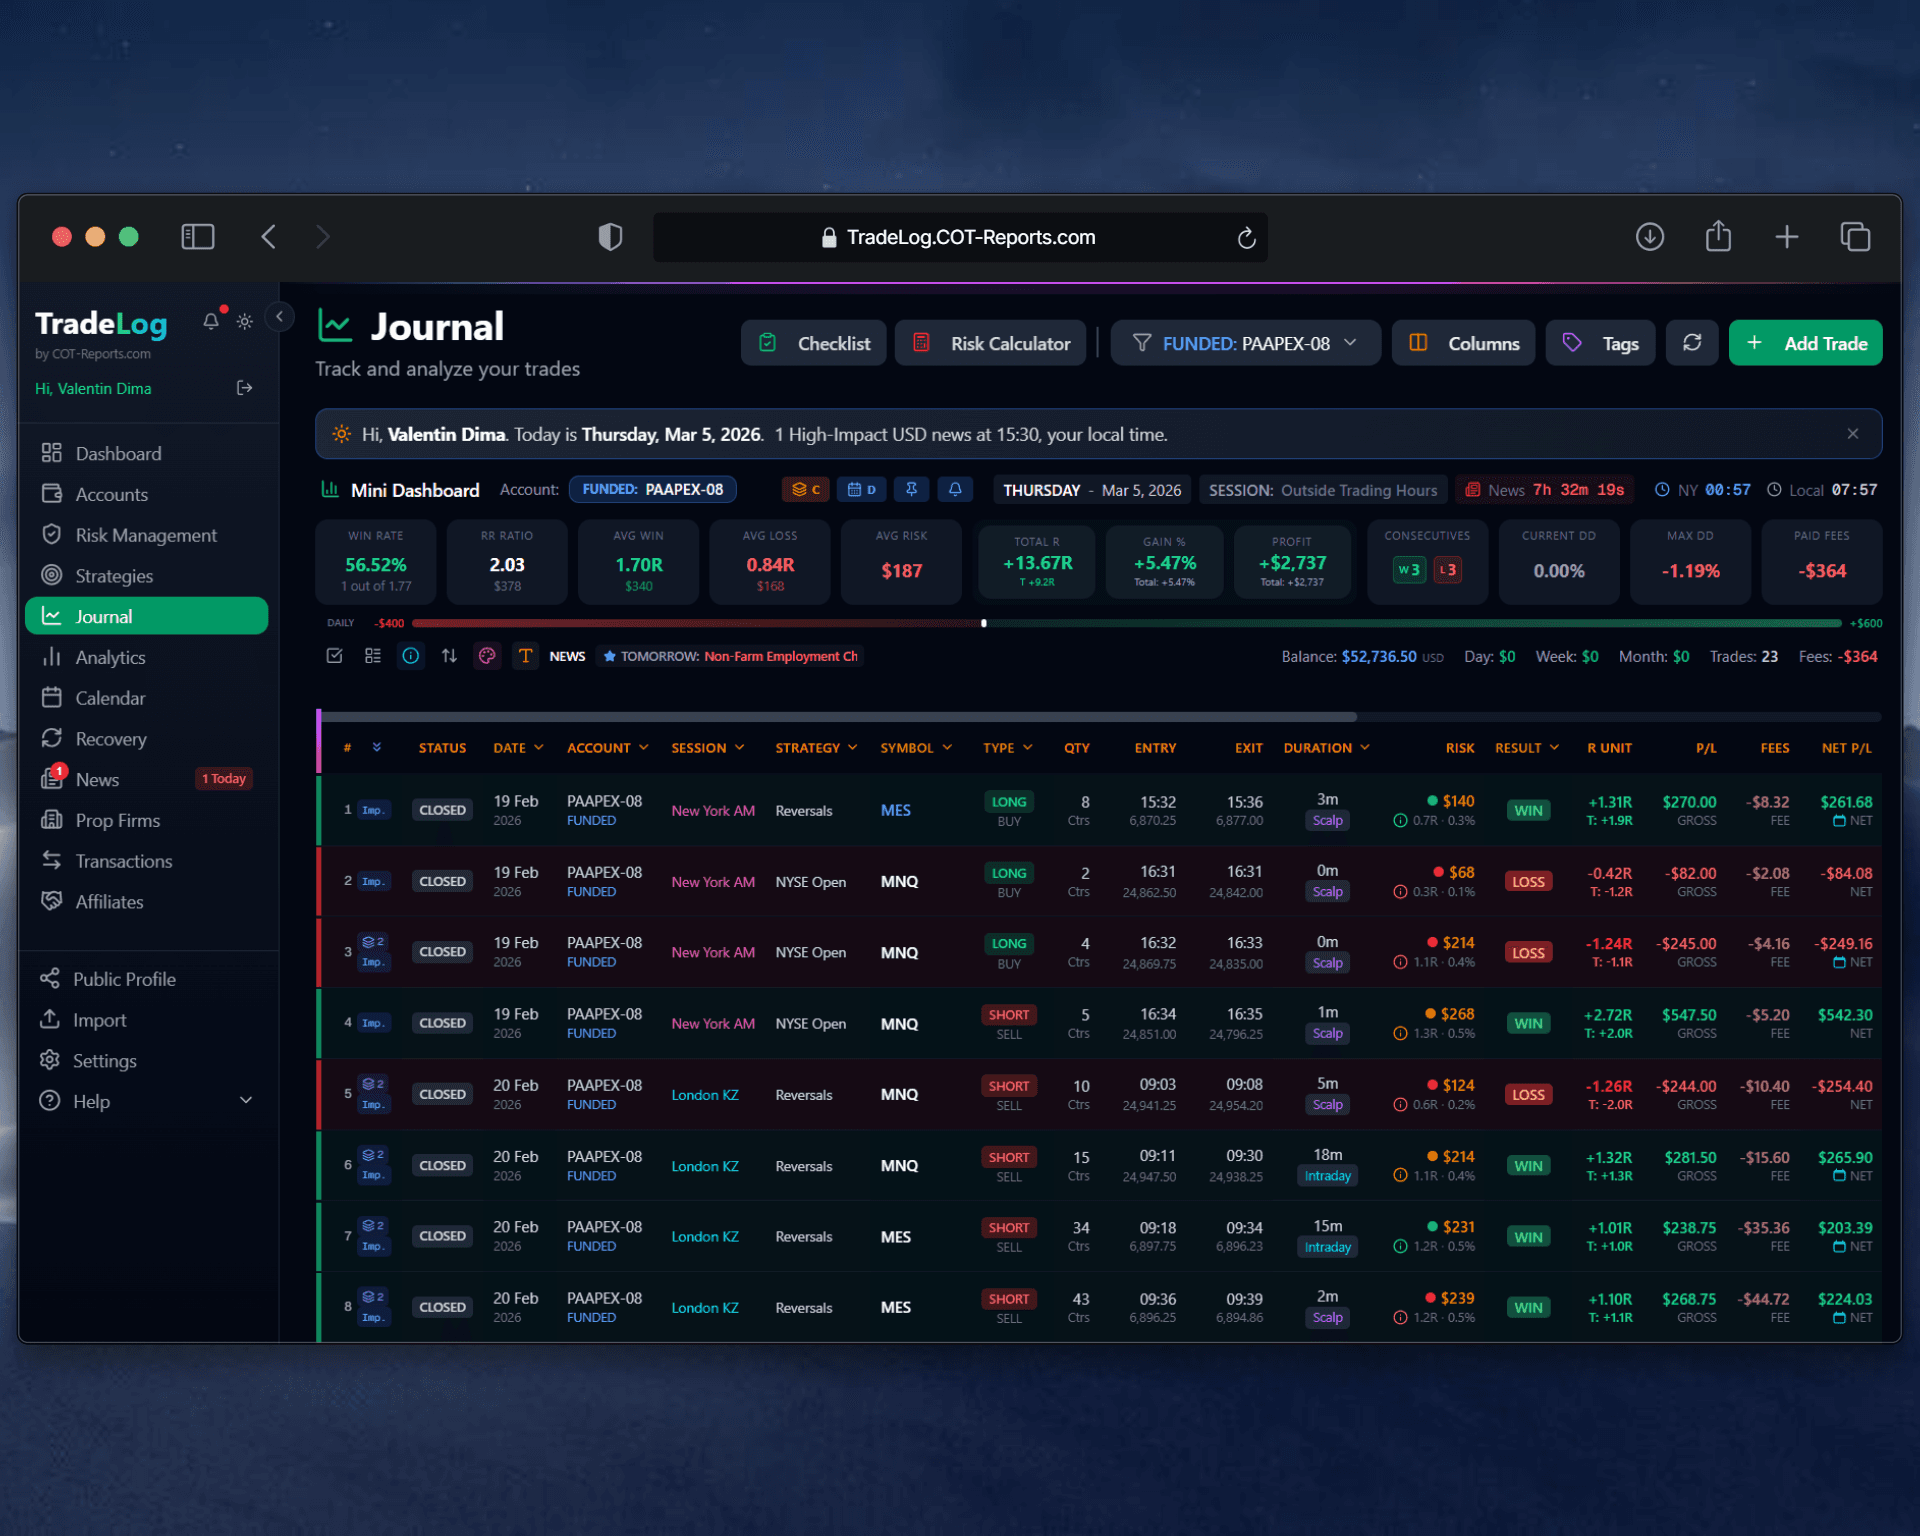
The founder's own prop-firm account (simulated trading). Not a typical result. Past performance does not guarantee future results.
Where a Trading Spreadsheet Falls Short
Spreadsheets are a great place to start. They just stop scaling the moment your trading gets serious.
You maintain the formulas
Every new metric means another column of formulas to write, copy down, and debug. One wrong cell reference quietly corrupts the whole sheet.
One typo skews everything
A misplaced decimal turns a small loss into a big one in your records — and your win rate, expectancy, and averages all inherit the error.
No live stats or charts
Win rate, profit factor, R-multiples, equity curve, session heatmaps — building those by hand takes hours, and they break every time you add a row.
No prop-firm guardrails
A spreadsheet can't watch your trailing drawdown, daily-loss limit, or consistency rule in real time. Funded accounts need more than cells.
The Spreadsheet Feel — Calculated for You
TradeLog's trade table works like the spreadsheet you already know. It just does the math, the stats, and the rules on its own.
Inline-edit cells
Click any cell and type. Edit entry, exit, size, or notes right in the row — exactly like a spreadsheet, no modal required.
Columns you control
Show, hide, and reorder columns to build the exact view you want. Your layout is saved — set it once, not twice.
Filter & sort instantly
Filter by date, symbol, direction, session, strategy, or result, and sort any column. The numbers update the moment you do.
P&L calculated automatically
Enter your fills and TradeLog computes net P&L, fees, and balance — point, tick, and pip values handled per instrument. No formulas to copy down.
R-multiples & stats, live
Win rate, average R, profit factor, expectancy, and your equity curve recalculate on every edit. No dashboard to wire up.
Every account in one table
Demo, evaluation, funded, and live accounts in one journal — switch context without a new tab or a copy-pasted template.
Spreadsheet Trading Journal FAQ
Moving off a spreadsheet? Here's what changes — and what doesn't.
Can I use a spreadsheet as a trading journal?
You can, and many traders start there. A spreadsheet handles basic logging fine, but you maintain every formula yourself and it can't auto-sync trades, monitor prop-firm rules, or update analytics in real time. TradeLog keeps the spreadsheet-style table and removes the maintenance.
Is TradeLog just a trading journal spreadsheet template?
No. It looks like a spreadsheet — rows, columns, inline editing — but it's a full journal. P&L, R-multiples, win rate, equity curve, and prop-firm tracking are calculated automatically, and trades can sync straight from your platform instead of being typed in.
How much does it cost compared to a free spreadsheet?
TradeLog starts at $19/mo. A spreadsheet is free up front. What it costs is the time spent on manual entry and formula upkeep. TradeLog calculates your stats automatically, which can surface a leak a sheet would hide.
Keep Reading
Trade the spreadsheet for a table that does the math
Keep the rows, columns, and quick edits you like. Let TradeLog handle the P&L, the R-multiples, and the stats — automatically.
Start Free TrialNo credit card required